CW operators have a fantastic tool to check out propagation. It’s a network called RBN (Reverse Beacon Network) with a bunch of receivers, called skimmers, who constantly monitor the CW sections of the amateur bands and decode the callsigns in there. The results are propagated via clusters and also visible on a map via the RBN website.
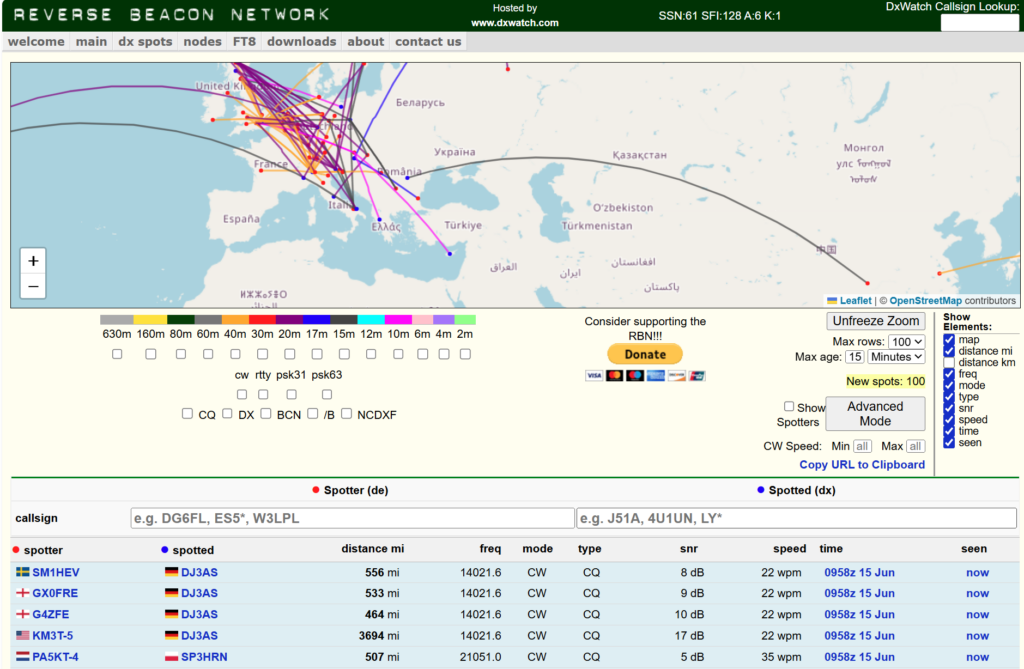
You can also track your own signals by entering your call in the Spotted field and see on the map where your signal lands. This is all fine and dandy, but it’s difficult to follow if the propagation improves or fades. Sure, you can have a look at the SNR and interpret from there. You can set a specific Spotter and only see spots from that one, or under the Advanced Mode settings see if your signal lands in a specific zone/continent/country and interpret the numbers from there.
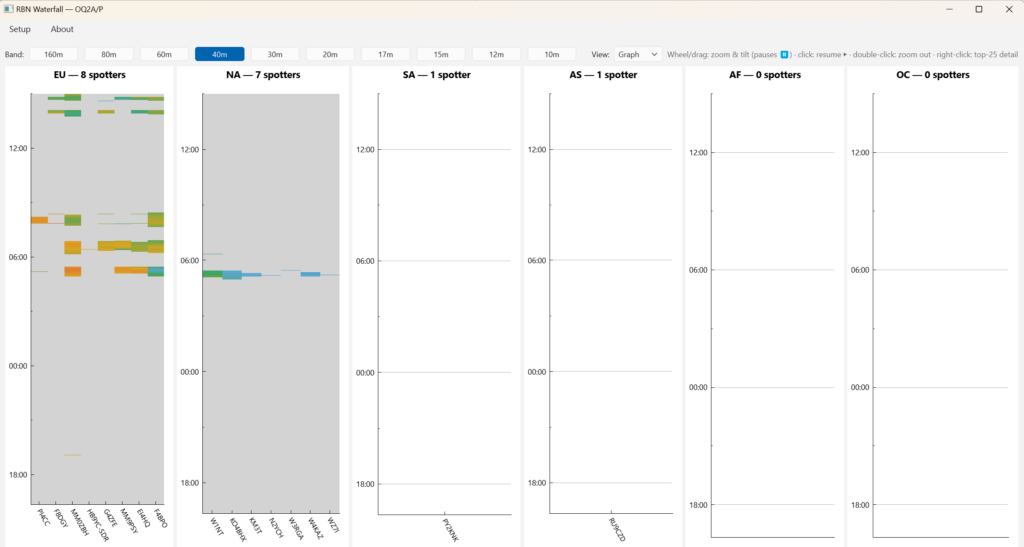
I wanted to visualise this a bit better for myself and so I put AI (Claude Code) to the task of helping me to design a program to visualise this better. My original design used a time-based scrolling waterfall-graph with the top 8 or top 25 skimmers ordered by amount of spots, split per continent. It was written in Python and it created new webpages every 5 minutes, accessible via webserver on the local network to show the current signal propagation.
I thought I was happy with that and gave it a trialrun at the recent CQWPX CW contest and UBA CW Fieldday. But then it’s shortcomings showed. I wanted to zoom in timewise on a graph, and the connection to the server wasn’t resilient. At fieldday we had a few power drops causing the WiFi-network to go down. The old Linux-box which had the python code running, recovered the WiFi-connection, but the connection to the RBN-server didn’t restart. So, back to the drawing-board, and improve the program.
AI is smart, but can be dumb. They are improving and Claude Code (CC) is one of the best helpers for code. But the quality of the code depends on their knowledge and your prompts. The more descriptive your prompts, the better it knows what to do.
So for the redesign I decided to change to QT6 and C++ as I better understand the code. Not that I am an expert, but in the main I can grasp why it does what it does. First instruction was to rebuild the program in C++. I had added a History feature in the Python-version for post-contest analysis, but, CC overlooked that bit. No harm done.
> awesome, but what happened to the history function?
● Good catch — I left history mode out and noted it in the README, but it really
  belongs in a full port.
From there on more features were added, and gradually improved.
- Zooming in the graph
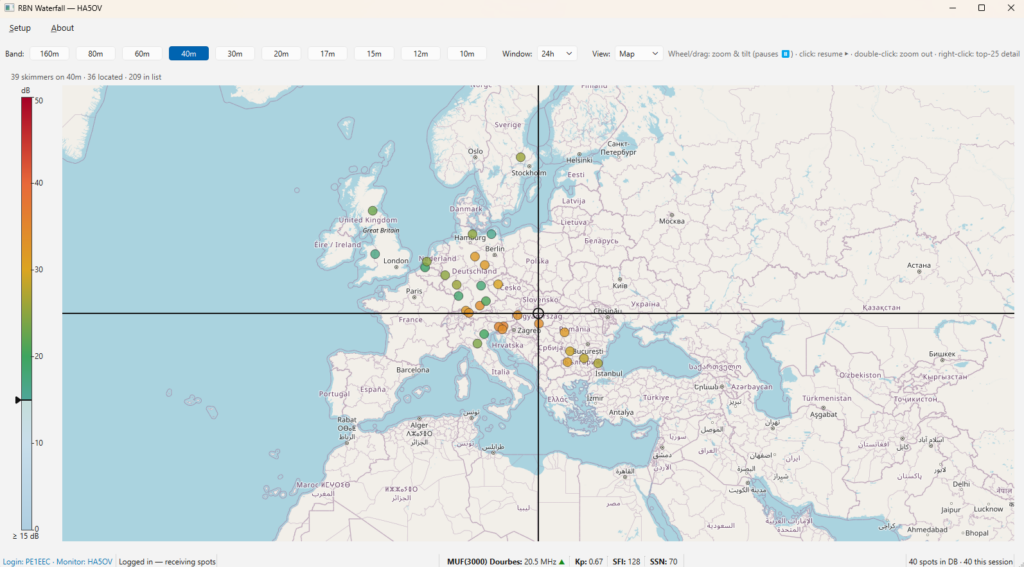
- Add a zoomable map, and show which skimmers received me
- Colour the plots to show signal strength
- Plots start to fade-out after 15 minutes of no new spots and disappear after 30 minutes
- Make changing call to monitor, dynamic
- Add solar data
- Add a setup menu
- More to come?
I made some specific design choices like using a specific RBN-server. This server is CW oriented so little chance of receiving spots from other modes. The program looks for this server’s specific spot format, so changing servers might not work, unless it uses the same format.

I still might have to fix a few things and improve or add more stuff, but I think for starters the program is ready for beta-testers. It is open-source, so have a go at it and take it apart and break it.
The source-code and Windows binaries can be found on my Github https://github.com/taekehf/RBNHeatMap